Electronic ISSN 2287-0237
This cross-sectional study aimed to test a method using the Radar Chart technique to yield continuous data of Areal Similarity Degree (ASD) to indicate the probability of having metabolic syndrome (Met-S).
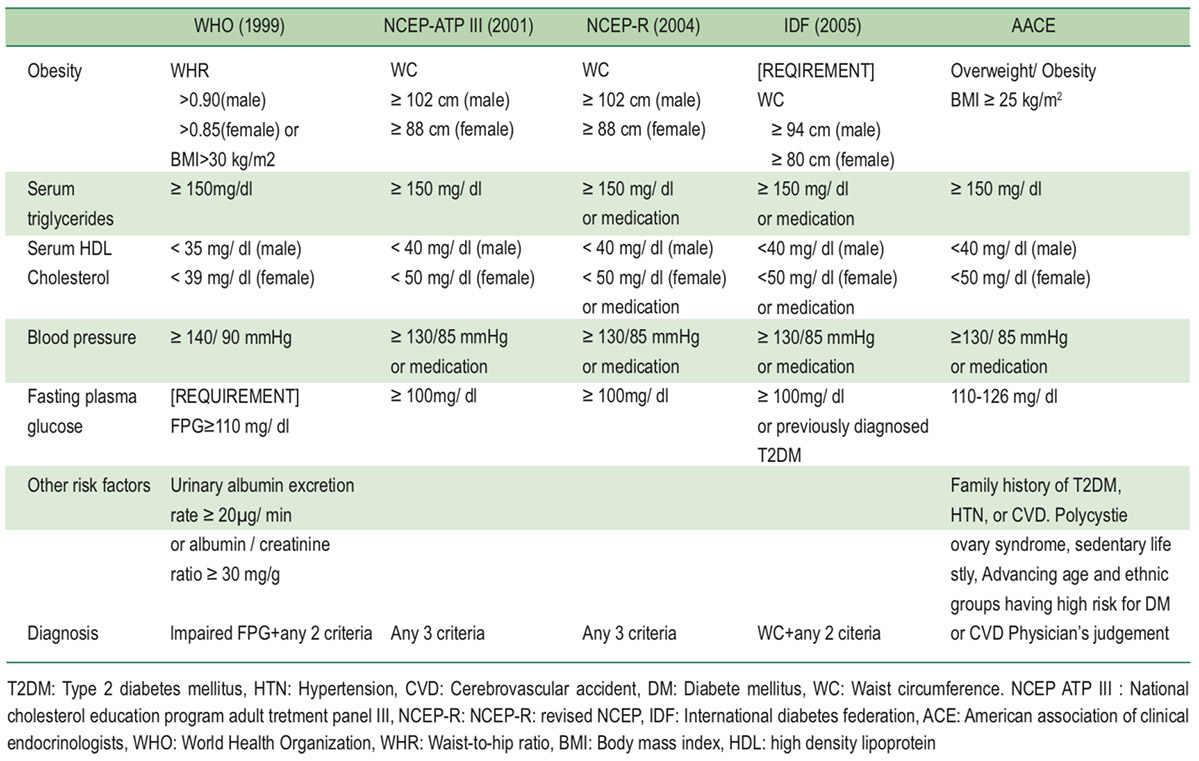
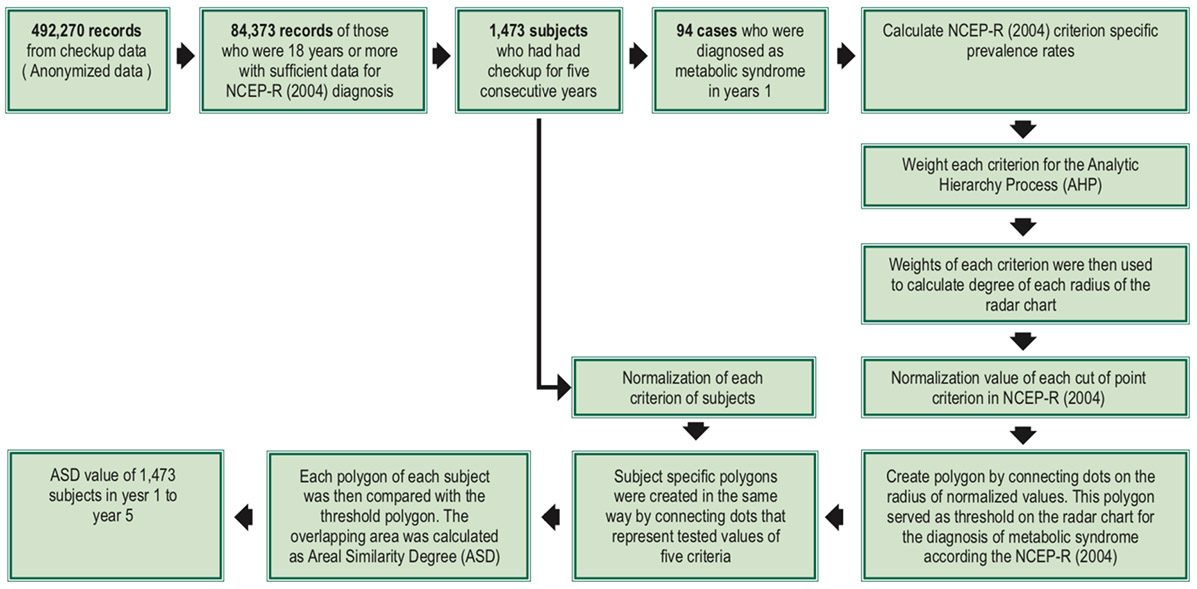
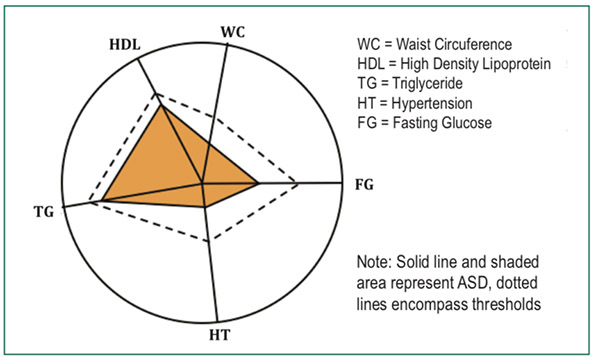
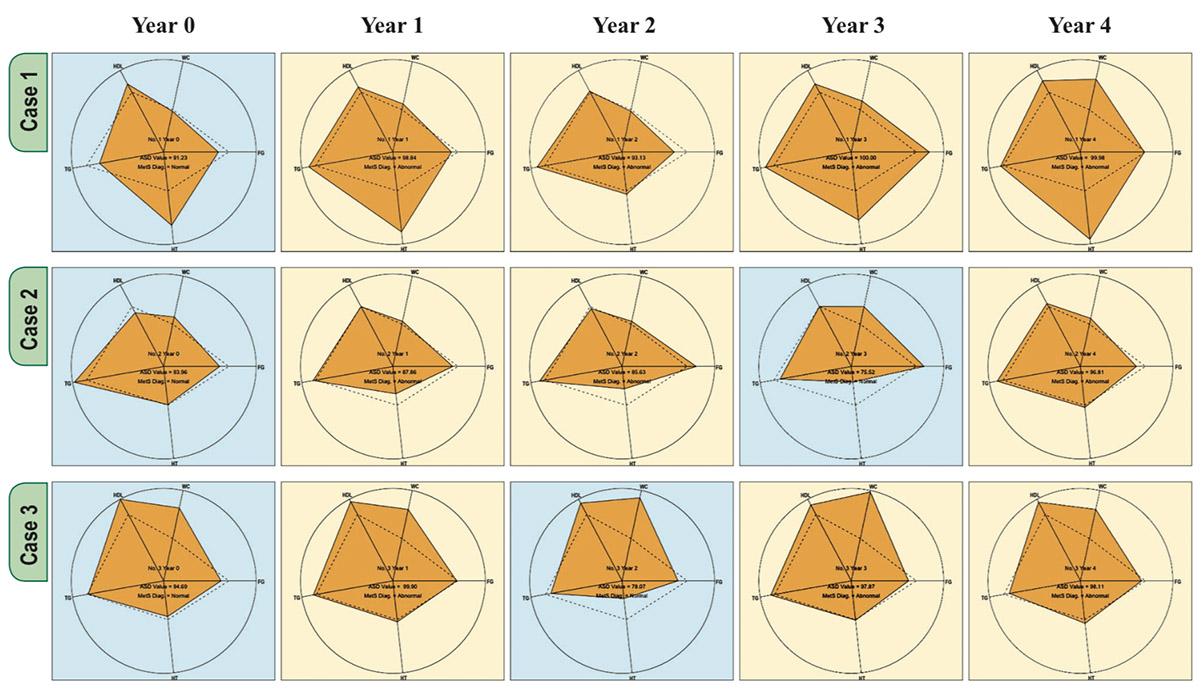
This study was conducted using anonymous data from a health checkup database. From 1,473 subjects who had five-year consecutive annual health checkups in a private hospital, we used The National Cholesterol Education Program Revised (NCEP-R) criteria version 2004 as the gold standard and applied the Radar Chart method as a screening test. All five criteria for NCEP-R were converted into angles and position of threshold on each radius of a radar chart. A polygon derived from these threshold values, which served as reference, was compared with each polygon arising from each subject’s test results. The overlapping area between the reference polygon and the subject’s polygon was defined as ASD, which indicates the possibility of having metabolic syndrome. A simple linear regression model was employed to identify ASD values that are comparable to one, two or three criteria of the five criteria of NCEP-R. The ASD value of three of the five criteria was used to label each subject and results were compared with the gold standard of NCEP-R to calculate sensitivity, specificity, positive and negative predictive values of the ASD method.
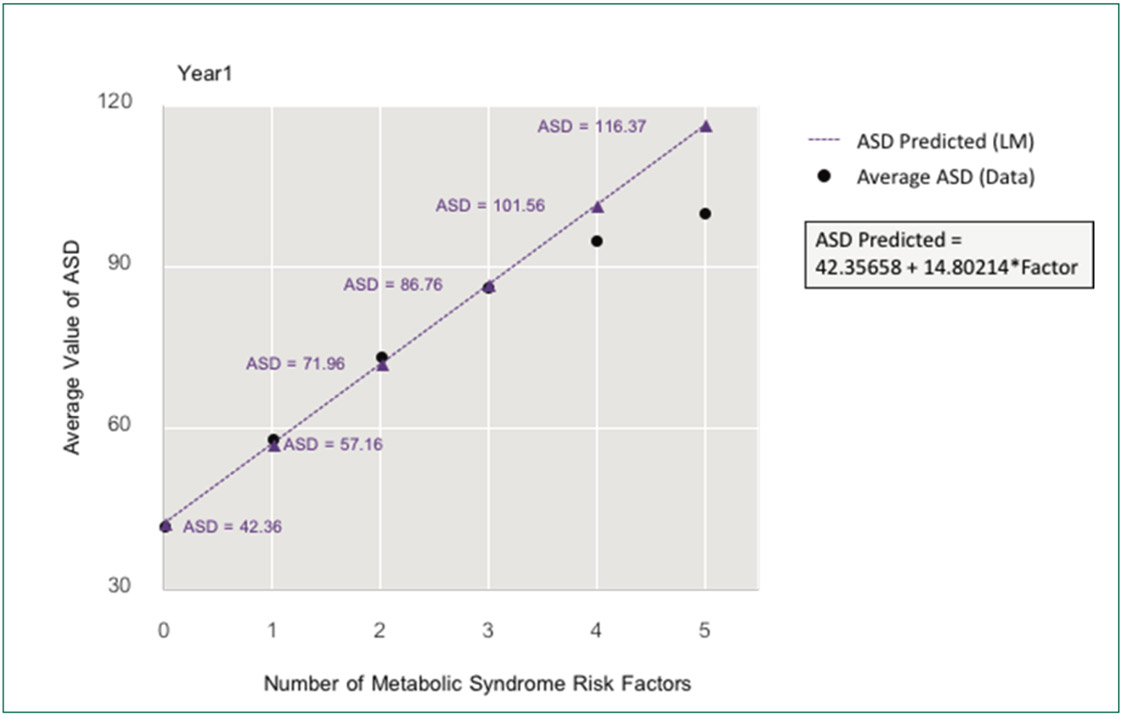
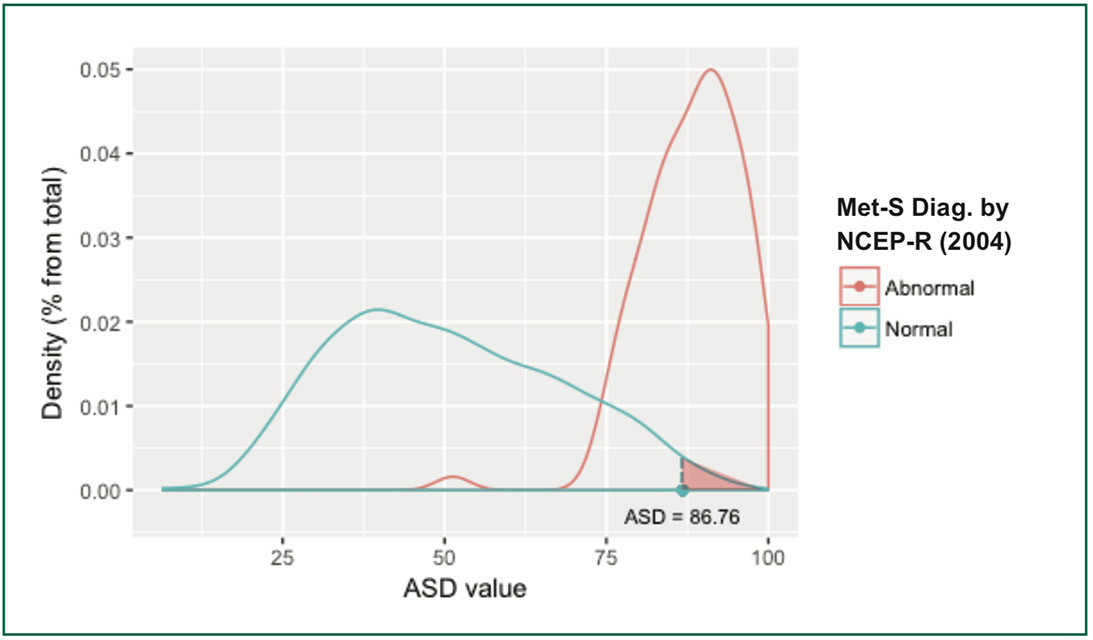
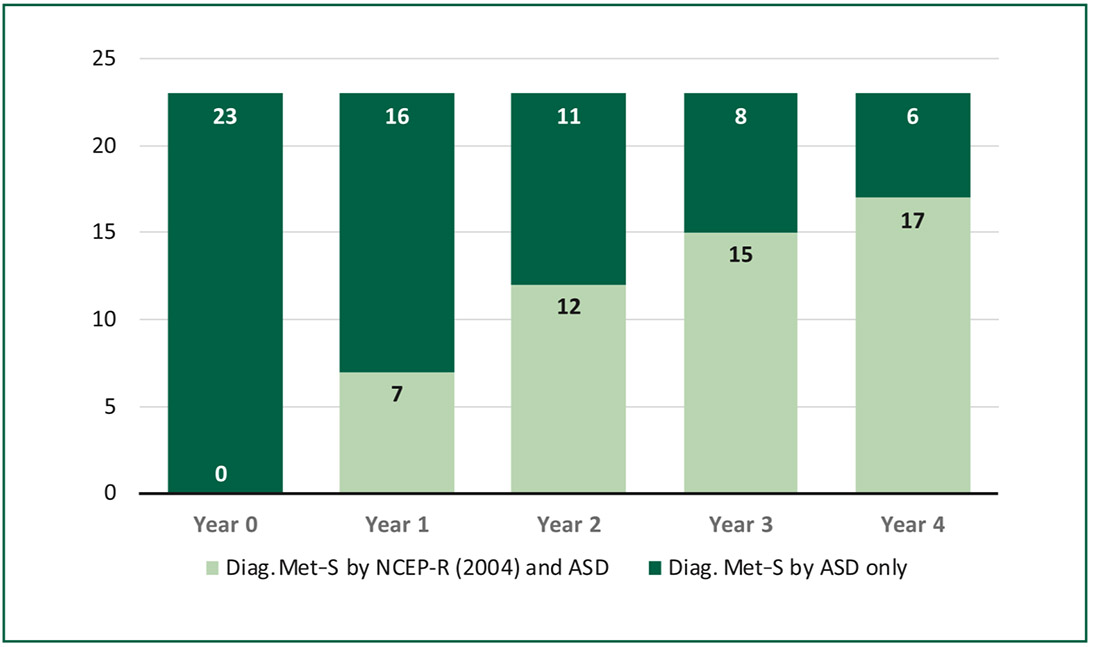
From 1,473 subjects, 94 (6.4%) were diagnosed as Met-S using NCEP-R criteria. Applying the Radar Chart – ASD method, these 94 subjects had an ASD value of between 51.29 and 100. The simple linear regression model revealed that an ASD value of 86.76 was comparable to three of the five criteria of NCEP-R. Using this 86.76 cut off point, the Radar Chart – ASD method could identify 23 additional subjects who had not previously been diagnosed with Met-S by NCEP-R in the first year. Among them, 17 (73.9%) progressed to have Met-S in four years, with a cumulative progression of 7 cases in one year, 12 cases in two years, and 15 cases in three years. From this data set, the 86.76 ASD cut off point had 66.0% sensitivity, 97.8% specificity, 67.4% positive and 97.7% negative predictive values.
The Radar Chart – ASD method was able to identify subjects who were firstly diagnosed as not having metabolic syndrome but were then to progress to Met-S in subsequent years. As a result, we recommend using Radar Chart – ASD method to supplement current sets of standard criteria for the diagnosis of Metabolic Syndrome. Medical practitioners could use information from this method to improve the motivation of those who are at an increased risk e.g. having a near threshold ASD value, thus making them able to reverse the course of the disease and to maintain healthy status. Further models using Machine Learning are being explored for improved accuracy.
metabolic syndrome, radar chart, diagnosis, accuracy, electronic health record (EHR), machine Learning
Received: May 21, 2018
Revision received: June 01, 2018
Accepted after revision: January 07, 2019
BKK Med J 2019;15(1): 11-18.
DOI: 10.31524/bkkmedj.2019.02.003