Electronic ISSN 2287-0237
Metabolic Syndrome (Met-S) is a serious health condition that is associated with increased risk for cardiovascular diseases (CVD), diabetes mellitus (DM), stroke and other diseases related with fat distribution and accumulation in arteries. The National Cholesterol Education Program’s Adult Treatment Panel III report (ATP III) identified metabolic syndrome as a multiplex risk factor for cardiovascular disease (CVD) that is deserving of more clinical attention.1 There have been several hypothesized mechanisms for the underlying pathophysiology of Metabolic Syndrome, and the most widely accepted of these is insulin resistance with fatty acid flux. Other potential mechanisms include low-grade chronic inflammation and oxidative stress.2 Diagnosis of Met-S could be made once a person has three or more of the following criteria:3
Although Met-S is a serious health condition, one can reduce her/his risks significantly by reducing body weight, increasing physical activity and having a healthy diet. It is, therefore, possible to reverse disease progression or even return to pre-Met-S through these lifestyle modifications.4-6
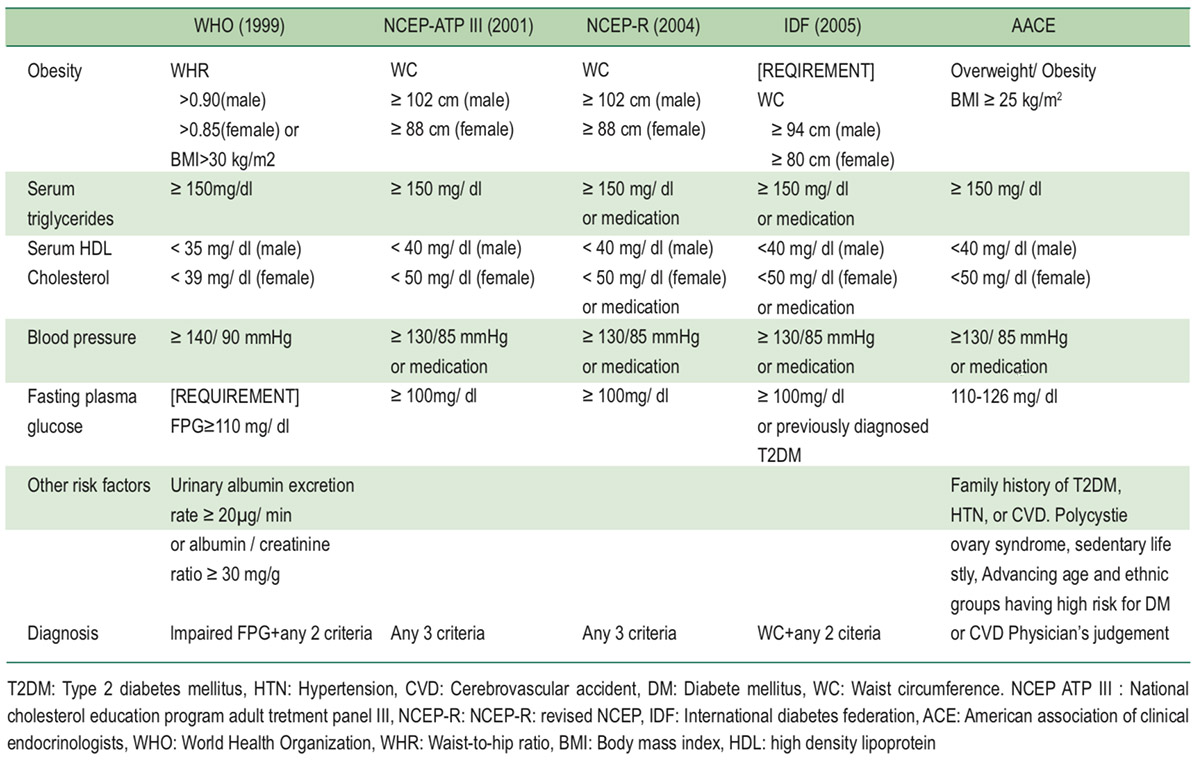
There have been several sets of diagnostic criteria for Met-S, such as World Health Organization (WHO) in 1999, The National Cholesterol Education Program Adult Treatment Panel III (NCEP-ATP III) in 2001, Revised NCEP (NCEP-R) in 2004, International Diabetes Federation (IDF) in 2006, and American Association of Clinical Endocrinologists (AACE) in 2003 (Table 1).7 Among different sets, obesity, serum TG, serum HDL, and BP are common factors. However, cut off points and interpretation are not identical, probably due to demographic diversity. This could affect consistency of diagnosis.6,7
Table 1: Comparison of five diagnostic guidelines of the metabolic syndrome7
Although un-identical, interpretation of each criterion relies on normal vs. abnormal results, i.e. dichotomous variables. As a result, all diagnostic criteria commonly suffer from interpreting normal among those almost abnormal and vice versa. In other words, continuous data are downgraded to dichotomous data. This could distort the perception of those who are quite close to having metabolic syndrome but are diagnosed as normal. As a result, the appropriate motivation to change lifestyle could be lessened. The challenge we would like to meet is to provide more accurate information on whether they are close to, or still far from, Met-S.
Radar charts are used to illustrate a summary of a set of performance variables, which are set on a respective radius in a circle. They are widely used because they can show all performance measurements in a visualized form. To create a radar chart, each variable is standardized from zero to one in order to fit on each radius, where one indicates the highest possible value (the point where a radius touches the circumference of the circle). The angle between each radius reflects weighted contribution of each variable towards the final outcome, and is standardized within the 360 degree limit of a circle. A variable with greater contribution results in a greater angle thus generating a greater sectorial area. With this approach, ASD of radar charts could be used to identify the degree of similarity between two sets of performance variables. We saw the possibility of applying this technique to diagnose Met-S.
So we conducted this study to test a method using Radar Chart technique to yield continuous data of ASD as an alternate method to diagnose Met-S. The area of a radar chart of each individual was compared with that area of normal cut off points. This provided more detailed information on an individual’s probability of having metabolic syndrome. As this method is still under investigation, we applied the technique only to anonymized data of electronic health records (EHR) of subjects in a health checkup clinic so results were not linked to standard diagnosis.
This retrospective study uses secondary data from the health information system. The team looked into anonymized data extracted from EHR of checkup clients who attended a health promotion clinic in a private hospital in 2010-2017 A.D. who were 18 years or older, both male and female, and selected those who had had an annual checkup for five consecutive years. Data were processed and analyzed using descriptive analysis and simple and multiple linear regressions. A diagnosis of Met-S relied on NCEP-R criteria in 2004. Relevant data of each subject were used to calculate ASD, which went into simple linear regression to identify the ASD value of having at least three of any positive criteria. This ASD value was used to (theoretically) diagnose subjects for metabolic syndrome. Diagnosis using ASD was compared with diagnosis using NCEP-R, which served as the gold standard for calculation of sensitivity, specificity, positive and negative predictive values of ASD method.
There were two steps to create the reference radar chart. The first step was to calculate weighted contribution for angles between two adjacent radiuses. The second step was to identify the location on each radius that represented the threshold of each criterion.
To calculate the angle between two radiuses, we followed the method described by Jeong S, et al.8 With this approach, the sample prevalence of each NCEP-R criterion was calculated from those who were diagnosed as having Met-S in the first year of their participation using the Analytic Hierarchy Process (AHP).9,10 Subsequently, the minimum and maximum possible values of each NCEP-R criterion was standardized to zero to one and the standardized threshold (cut off point) levels were placed on each radius thus creating a reference polygon.
From 492,270 records of checkup data, there were 84,373 records of those who were 18 years or older with sufficient data for NCEP-R diagnosis. Among these, there were 1,473 subjects who had had an annual checkup for five consecutive years. We then studied data of these 1,473 subjects as one group retrospective cohort (Figure 1).
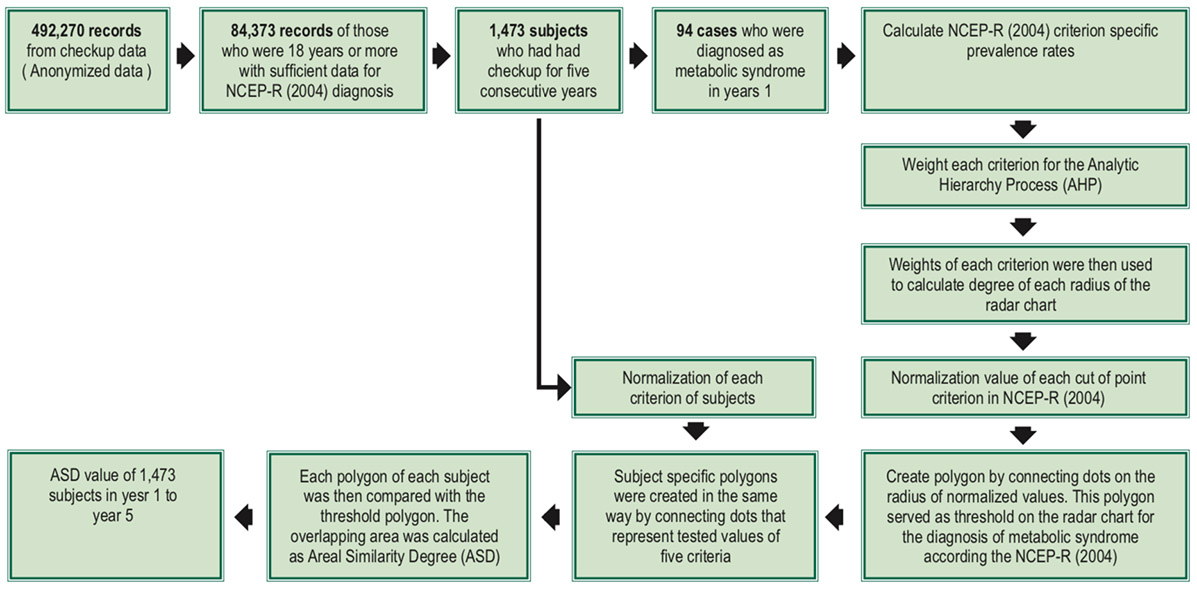
Figure 1: ASD value calculation process
Among 1,473 subjects, 645 (56.2%) were male and 828 (43.8%) were female. Average age was 46.5 + 13.0 years among males and 46.7 + 12.3 years among females. Age distribution was similar between genders. Male subjects had generally higher average values of BMI, FG, TG, and BP with lower HDL (Table 2).
Met-S was found to be more frequent among older age groups for both male and female. Using NCEP-R criteria, 2.2, 4.6 and 15.0 percent of young, middle-aged and old-aged female subjects were diagnosed as having metabolic syndrome while positive rates among male subjects were 4.3, 9.0, and 12.0 percent. Overall prevalence rates of testing positive for the five criteria of FG, WC, HDL, TG, and BP were found to be 70.2, 36.2, 64.9, 77.6 and 75.5 percent respectively (Table 2).
Creating the reference radar chart
Data from 94 cases diagnosed as metabolic syndrome in year 1 were used to calculate NCEP-R criterion specific prevalence rates, which were required to weight each criterion for the Analytic Hierarchy Process (AHP). The weight of each criterion was then used to calculate the degree of each radius of the radar chart, which represented each criterion according to NCEP-R as already described in the Methods section. Allocation of angles is shown in Table 3. A standard radar chart was then created as Figure 2.
Data from 1,473 subjects were then separated into two groups, year 1 and year 2 to year 5. Data from year 1 were used to calculate threshold for ASD method diagnosis, while data from year 2 to year 5 were used for testing and following up for diagnosis of Met-S according to NCEP-R criteria.
Finding ASD threshold
The polygon of the reference radar chart from Figure 2 served as the threshold for the diagnosis of metabolic syndrome according the NCEP-R. Subject specific polygons were created in the same way by connecting dots that represented tested values of the five criteria of each subject. Each polygon of each subject was then compared with the threshold polygon. The overlapping area was calculated as ASD, which represented the probability of having metabolic syndrome for each individual (Figure 3).
Table 2: Characteristics of study subjects in the first year (n = 1,473)
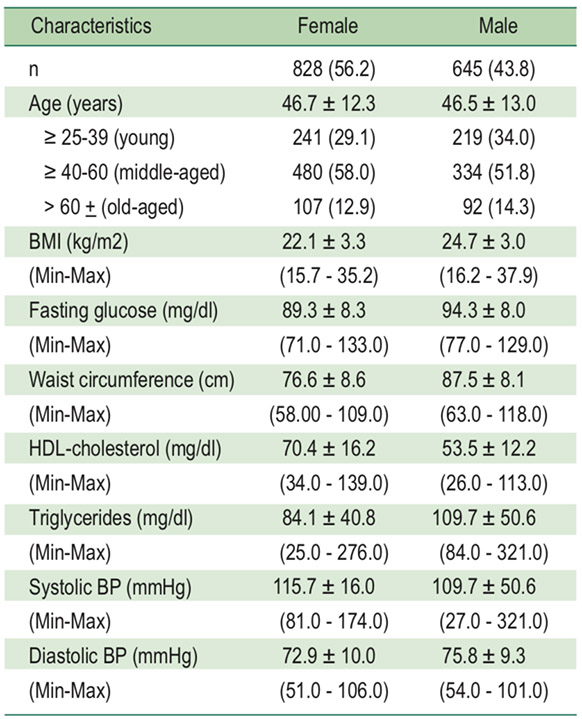
Table 3: Computed weights for each factor and allocation of angle in radar chart
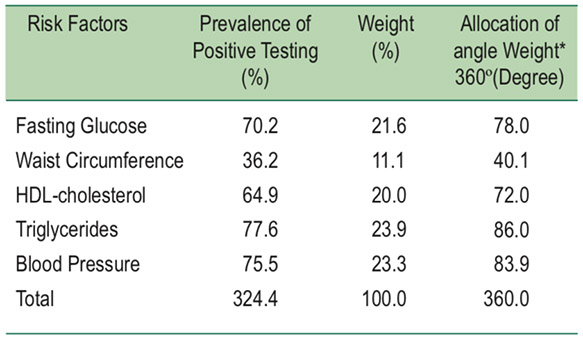
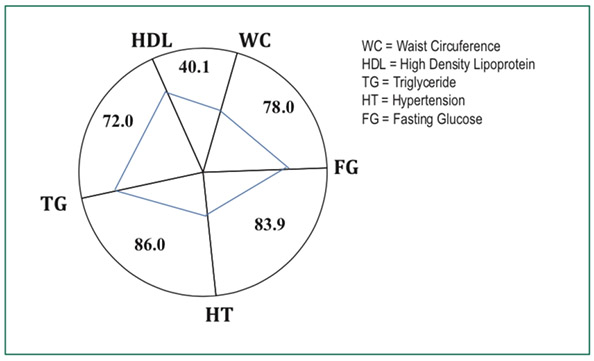
Figure 2: Reference radar chart according to data collected and NCEP-R criteria.
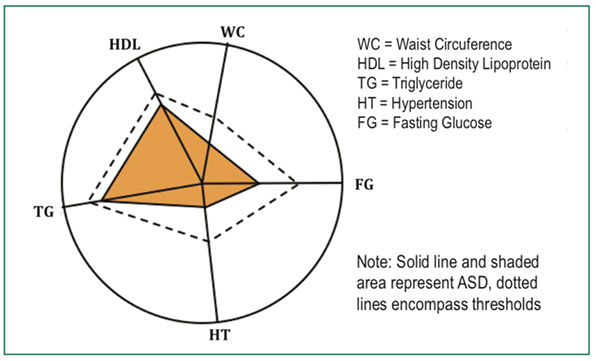
Figure 3: Subject specific ASD (shaded polygon) in comparison with the reference polygon (dashed lines).
A simple linear regression was then employed to identify average ASD values of being positive for none (zero), one, two, three, four and five criteria (Figure 4). The value of having at least three criteria was used to (theoretically) diagnose subjects as having metabolic syndrome.
As described in the methods section, the threshold polygon was used to compare with the subjects’ polygons and a subject specific ASD was calculated. We found an increased trend of average ASD values with increased number of positive results. Average ASD of subjects with zero (none), one, two, three, four and five positive criteria were found to be 41.9, 58.0, 73.3, 86.1, 95.0 and 100 respectively. They are shown in Figure 4 as rounded dots.
From a multiple linear regression model, with R2 of 0.5789, the ASD values that predict positive results of zero (none), one, two, three, four and five criteria were 42.36, 57.16, 71.96, 86.76, 101.56 and 116.37. They are shown in Figure 4 as triangular dots and connected with a dashed line.
We pay attention to the ASD value of 86.96 from this linear regression model and will use it as cut off point for supplemental diagnosis of Met-S.
Sensitivity and Specificity of ASD method
Diagnosis using this ASD method was compared with diagnosis using NCEP-R method for the calculation of sensitivity, specificity, positive predictive value and negative predictive value where the NCEP-R method served as the gold standard.11-13
The ASD value of 86.76 was used as a screening test in comparison with NCEP-R criteria, which served as the gold standard. This method yielded 65.95% sensitivity, 97.82% specificity, 67.39% Positive Predictive value (True Positive), 97.68% Negative Predictive value (True Negative) and 98.7% accuracy rate.
Applying this 86.76 value to data of year 2 to year 5, we found sensitivity from 60.4% - 68.7%, specificity 97.4% - 97.8%, positive predictive value 62.0% - 67.3% and negative predictive values 97.0% - 98.1% and 94.9% - 95.9% accuracy rates (Table 4).
Table 4: Sensitivity, Specificity, Positive/Negative Predictive Value (PPV/NPV) and Accuracy of using ASD = 86.76 (Screening test) in comparison with NCEP ATP-III criteria (Gold Standard).
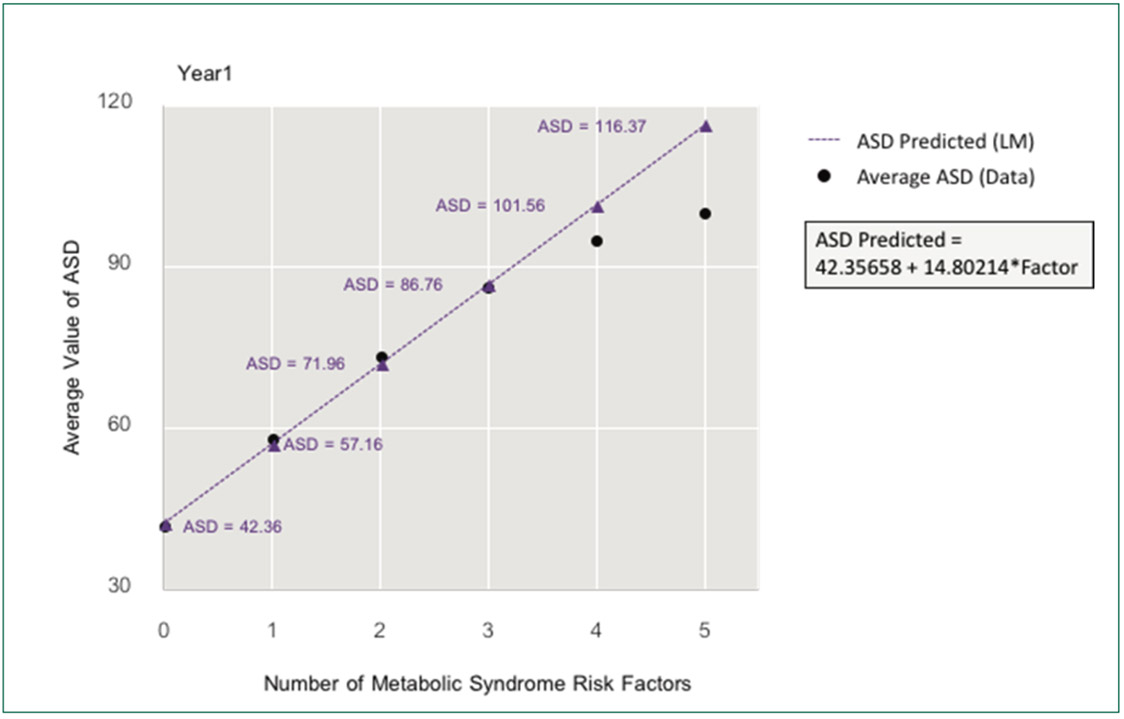
Figure 4: A simple linear regression model of ASD values in comparison with average ASD of subjects with various number of positive criteria
Value of ASD method
As mentioned, among the 1,473 subjects, 94 (6.4%) were diagnosed as having metabolic syndrome according to NCEP-R. Applying the ASD value of 86.76 we identified 23 (1.6%) additional subjects who were shown to be positive by the ASD method but had been marked as negative by NCEP-R criteria in the first year. This is illustrated as the shaded area in Figure 5.
Following up these 23 cases historically, after the first year of non-metabolic syndrome according to NCEP-R, 17 (73.9%) fulfilled NCEP-R criteria of having metabolic syndrome in subsequent years (7 in one year, 5 in two years, 3 in three years and 2 in four years) as shown in Figure 6.
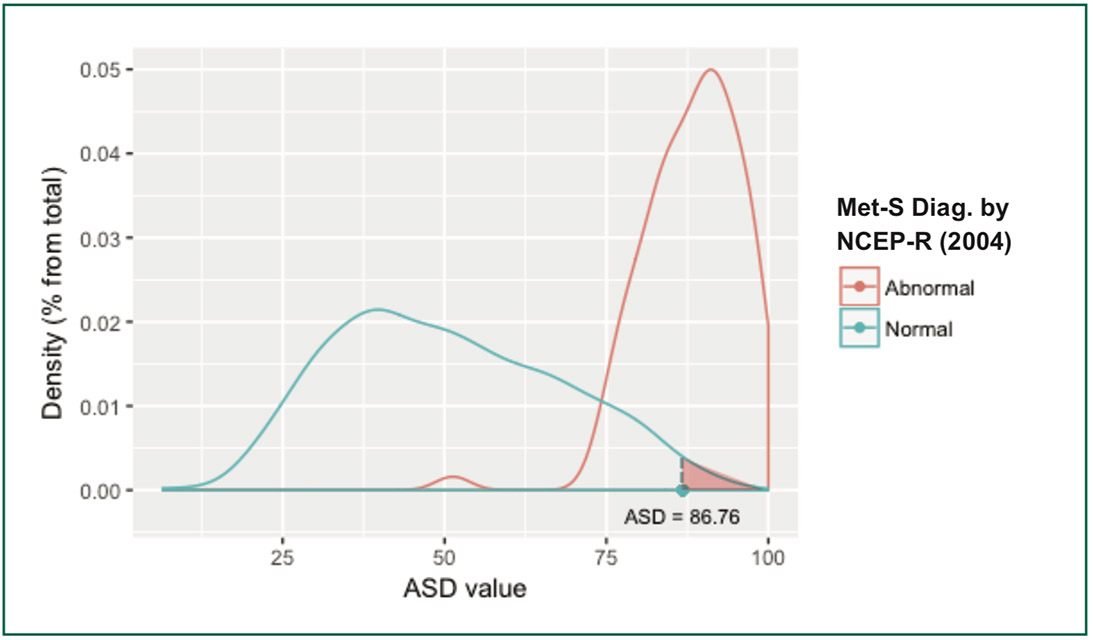 Figure 5: Density of NCEP-R Met-S diagnosis by ASD value
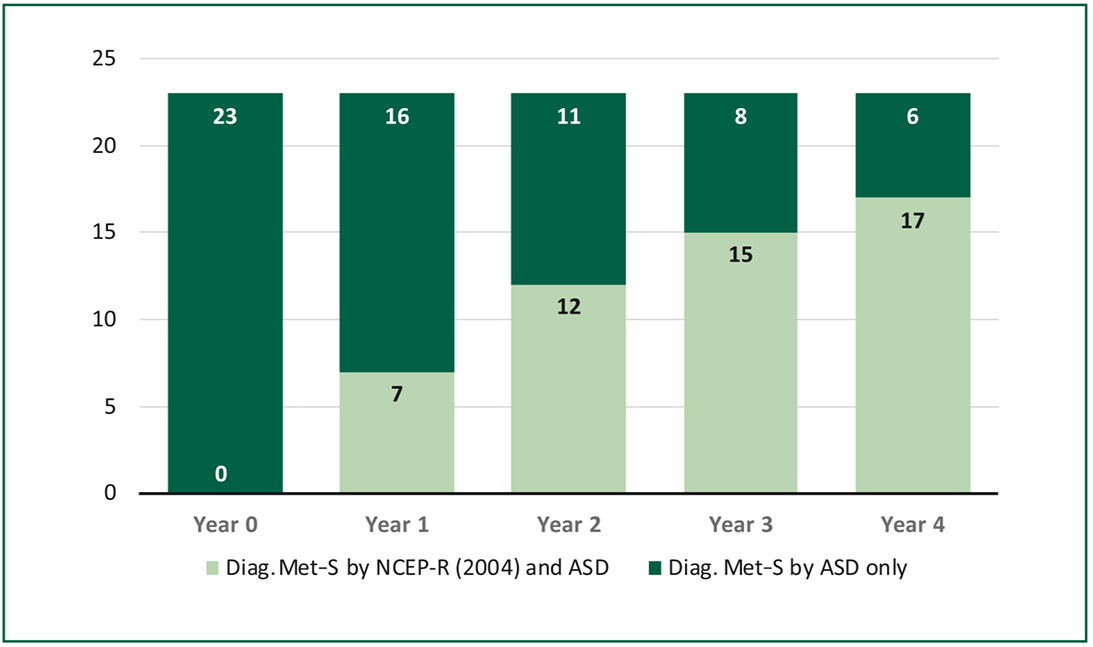
Figure 6: Diagnosis of Metabolic Syndrome using NCEP-R and ASD.
As known, metabolic syndrome is reversible, yet this has not been well demonstrated. Using the ASD method, we were able to track down borderline cases that turned from negative to positive for metabolic syndrome. Figure 7 shows examples of three cases where the first one progressed from negative (blue shaded) in the first year to positive (pink shaded) and
remained positive in the second to fourth years, while the other two cases moved forward and backward for Met-S. This visualization could provide more information to individuals who are on the borderline to encourage them to adjust their lifestyles in a timely manner to avoid a positive Met-S diagnosis or even to move back from a positive to a negative.
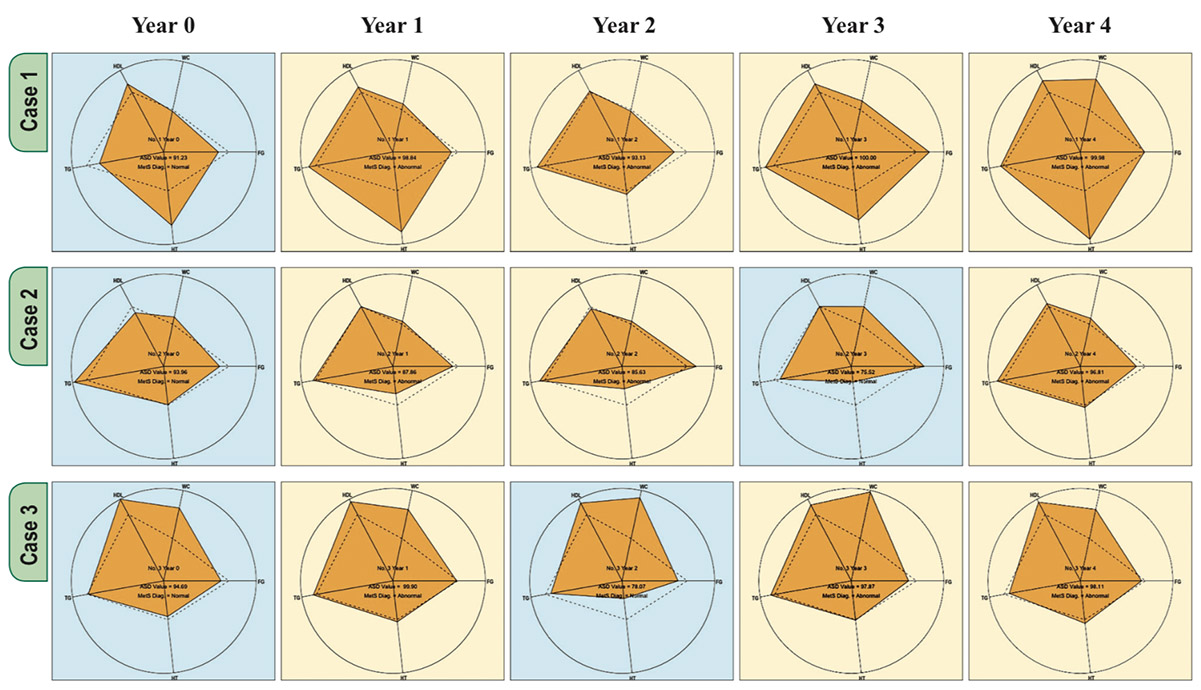
Figure 7: Examples of ASD changes among 3 subjects followed-up for 4 years.
The ASD used in this study was the overlapping area in the radar charts between the threshold (diagnostic reference) polygon and individuals’ polygons. From this dataset, the ASD value of 86.76 yielded 95.8% accuracy for the diagnosis of metabolic syndrome, in comparison with NCEP-R, with a 67.4% positive predictive value and a 97.7% negative predictive value. Given the moderate positive predictive value, this method is not suitable as a screening tool for Met-S. However, with the high negative predictive value, it has the advantage of assuring negative results.
We recommend using ASD to supplement current sets of criteria in diagnosing metabolic syndrome, particularly to identify those who did not meet the criteria but do test positive by the ASD method. This population with borderline test results could be motivated to make lifestyle changes due to the additional information provided by the ASD method.
Similar to other retrospective research, this study suffered from incomplete data. The hospital checkup record system was not designed for metabolic syndrome research. In addition, our data were not representative samples of those who really had metabolic syndrome. Prevalence rates found here could have been biasedly low because of different judgment of checkup physicians on which tests to request for each particular subject. This has resulted in another limitation. Only a small fraction of patients had the complete data required for the ASD method in that all five criteria must be available. Another weakness was from using only the overlapping area of ASD, which was the subset of the threshold area. Subjects with ASD exceeding the threshold required another justification for diagnosis. This is a potential topic for further research.
Our team is exploring the possibility of applying Machine Learning techniques to utilize more data that are being collected for improved accuracy for diagnosis of Met-S particularly among different age groups, genders and other medical as well as behavioral characteristics. This would add more clinical benefits to those who are at moderate risk and might expand our knowledge on the chronological aspect of progressing from moderate to higher risks for Met-S. We hope to be able to inform patients much earlier in their lives on the long term effects of their current healthy or risky behaviors.
This study demonstrates that using the ASD method could add value to the NCEP-R method, particularly among subjects who were almost positive by the NCEP-R method. An additional 1.6 percent of subjects in this study were diagnosed as metabolic syndrome with the ASD method, and 73.9% of them progressed to have metabolic syndrome in four years. An advantage could be the additional information of the ASD method that took into account prevalence rates of each criterion using continuous instead of dichotomous data.
In this study we used the ASD value of 86.67 for both genders and all age groups because of the limited number of subjects. Those who are interested in refining age and gender specific ASD values could employ the same method in a larger set of subjects.
This ASD method should be used by health practitioners in both check-up and medicine departments to provide supplemental data to clinic attendees for assessment of risk for Met-S. The general public could also use this method to monitor individual progress towards or away from having Met-S. This could be done easily with an online application.
We would like to express our sincere thanks to Mr. Veerasak Kritsanapraphan, Bangkok Hospital Headquarter, and Dr. Arnond Sakworawich, National Institute of Development Administration (NIDA) for their technical advice especially on R Programming. We also feel grateful for the staff of GreenLine Synergy for data extraction and maintaining data files for analysis.
The authors declare no conflict of interest.